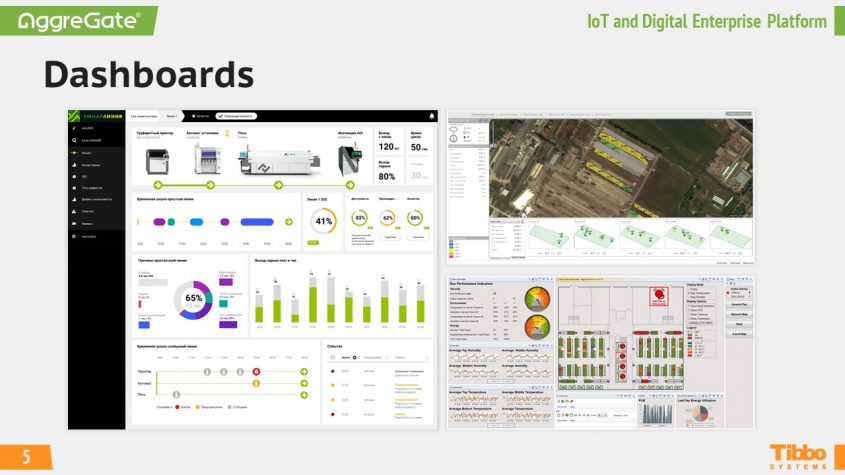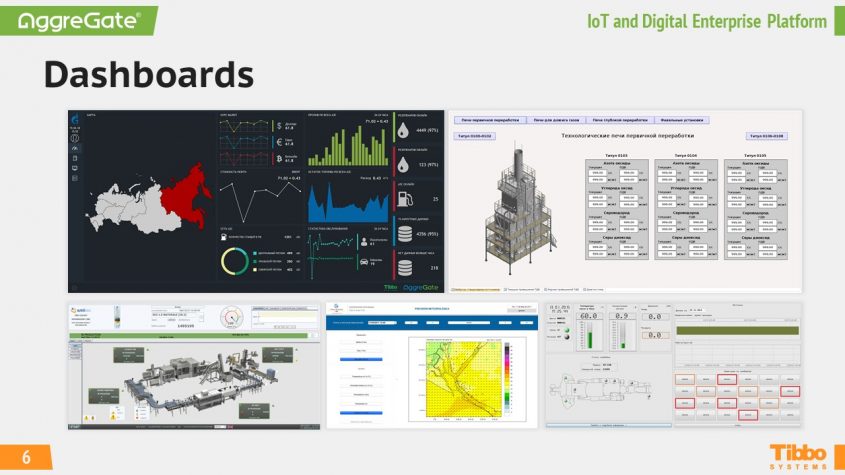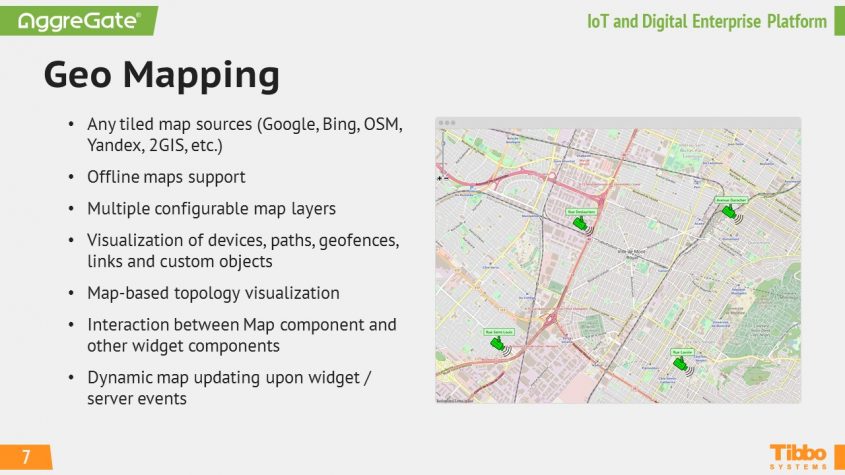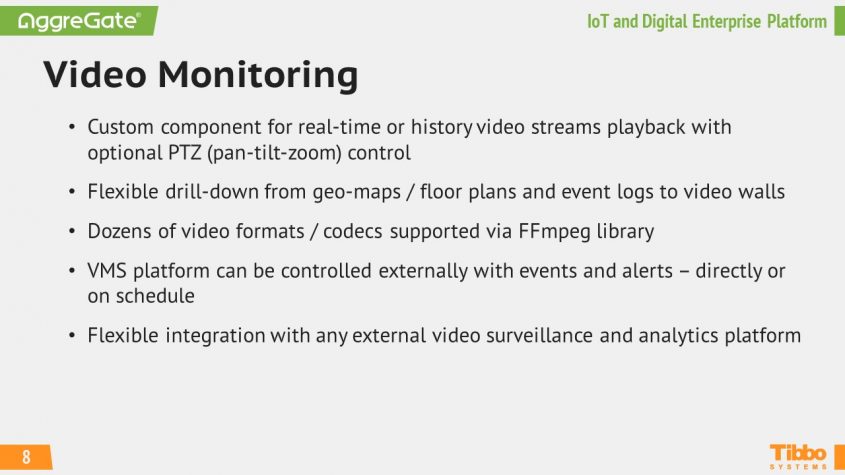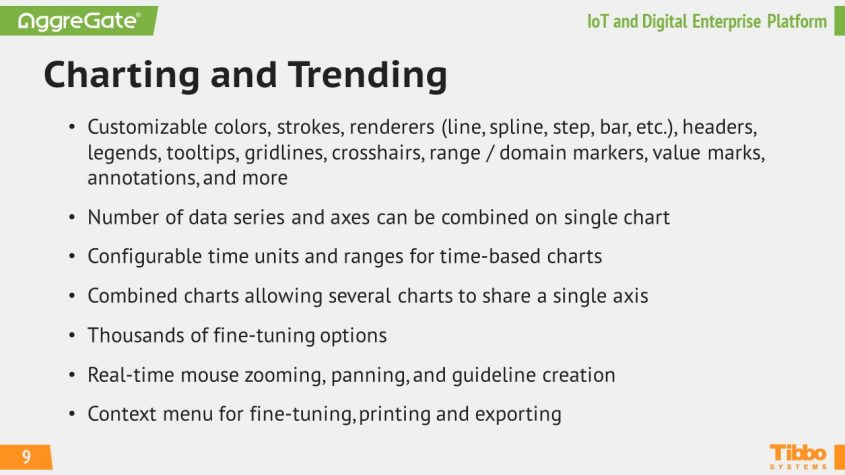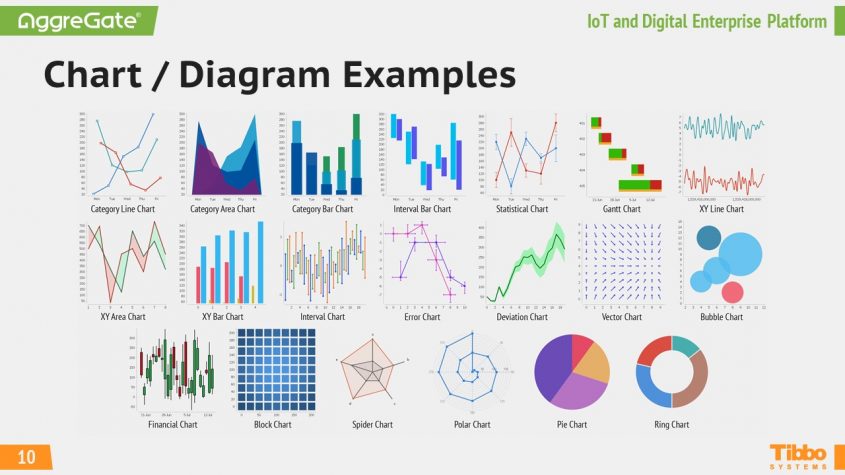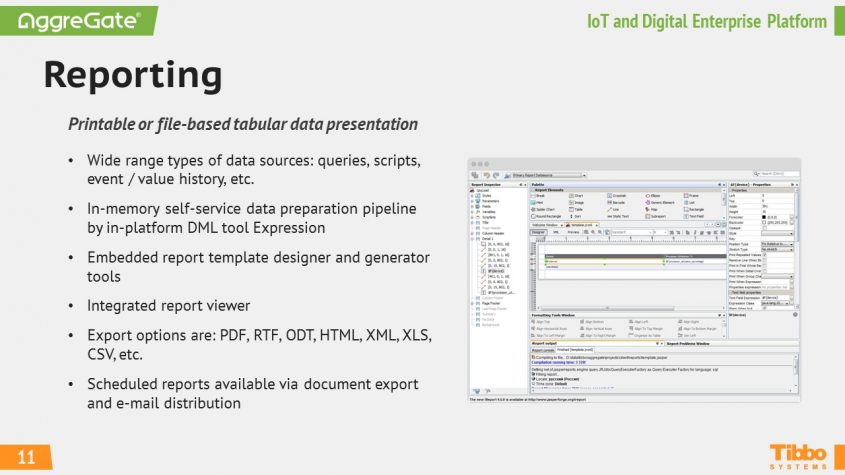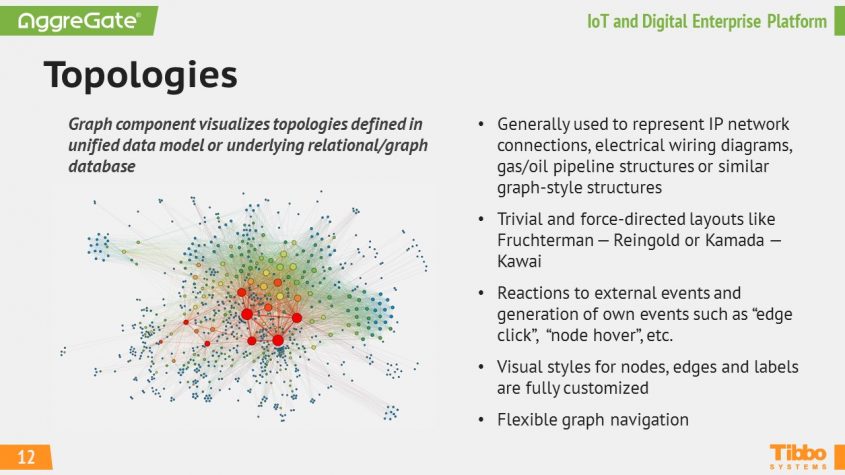
Every comprehensive IoT platform has several components in its architecture. It all starts with connectivity, followed by normalization, storage, management, analytics. Then all the collected, processed and analyzed data needs to be shown to users in an understandable, friendly, and nice way. For this, AggreGate allows you to design pixel-perfect interfaces and to visualize everything that happens to “things”. As you have guessed, it’s our traditional series of posts — AggreGate Technologies.
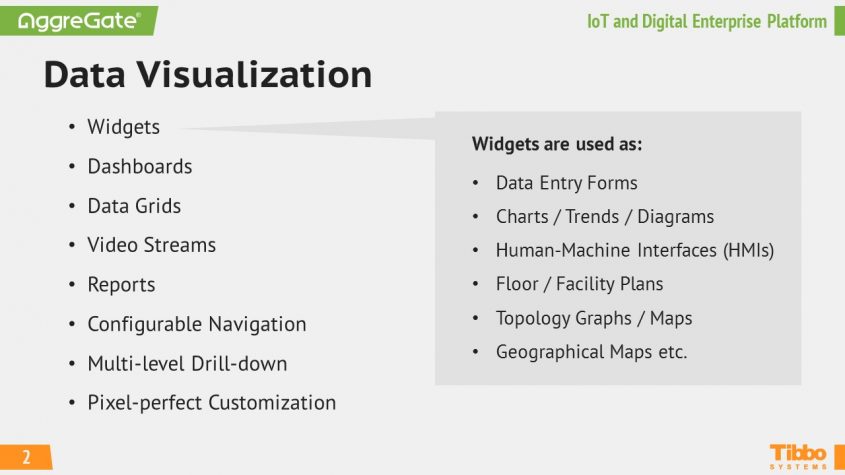
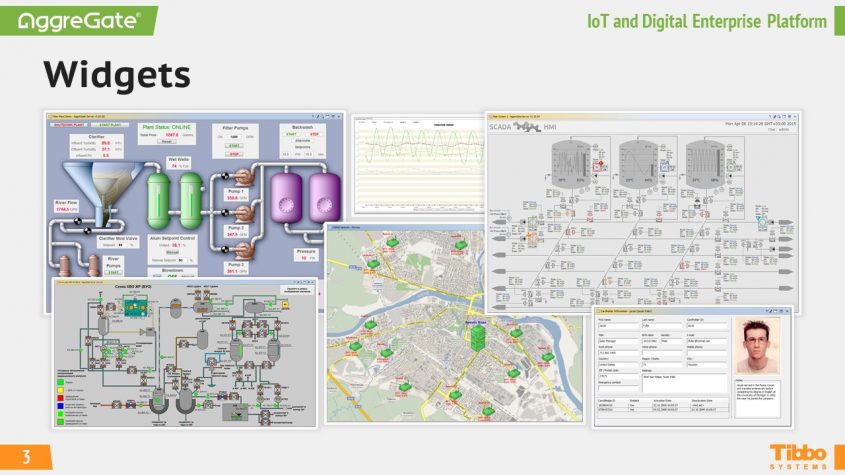
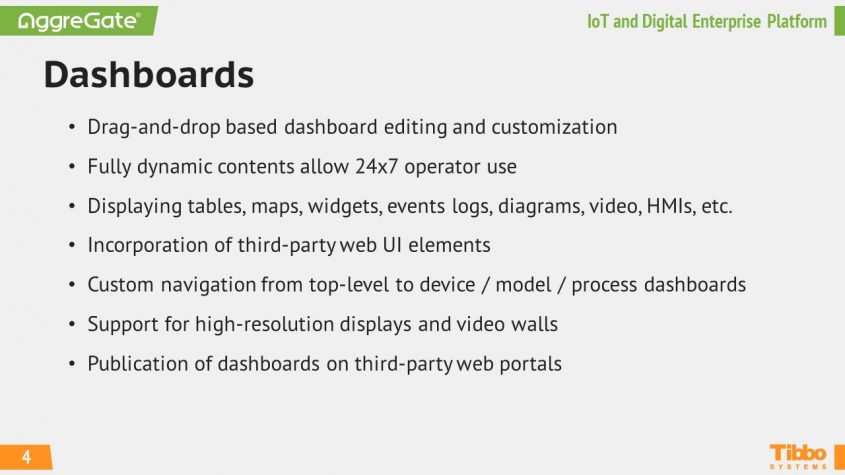
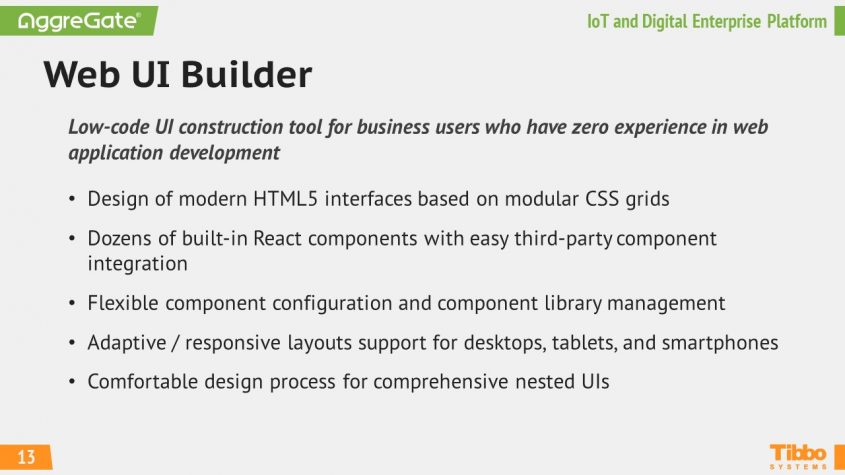
AggreGate offers a huge set of data visualization tools developed with maximum flexibility to build any IoT application interface. These tools are like building blocks that can be combined and customized in visual editors even by users with no programming experience.
Learn more in the presentation:
Find more information on the Visualization page. And if you still have questions, ask them here.
