Do you know that besides providing network monitoring capabilities our AggreGate Network Manager is offering comprehensive support for management of Telecom and Corporate networks?
Wanna know how can it make changes to your net and control it? Check the new Network Management page.
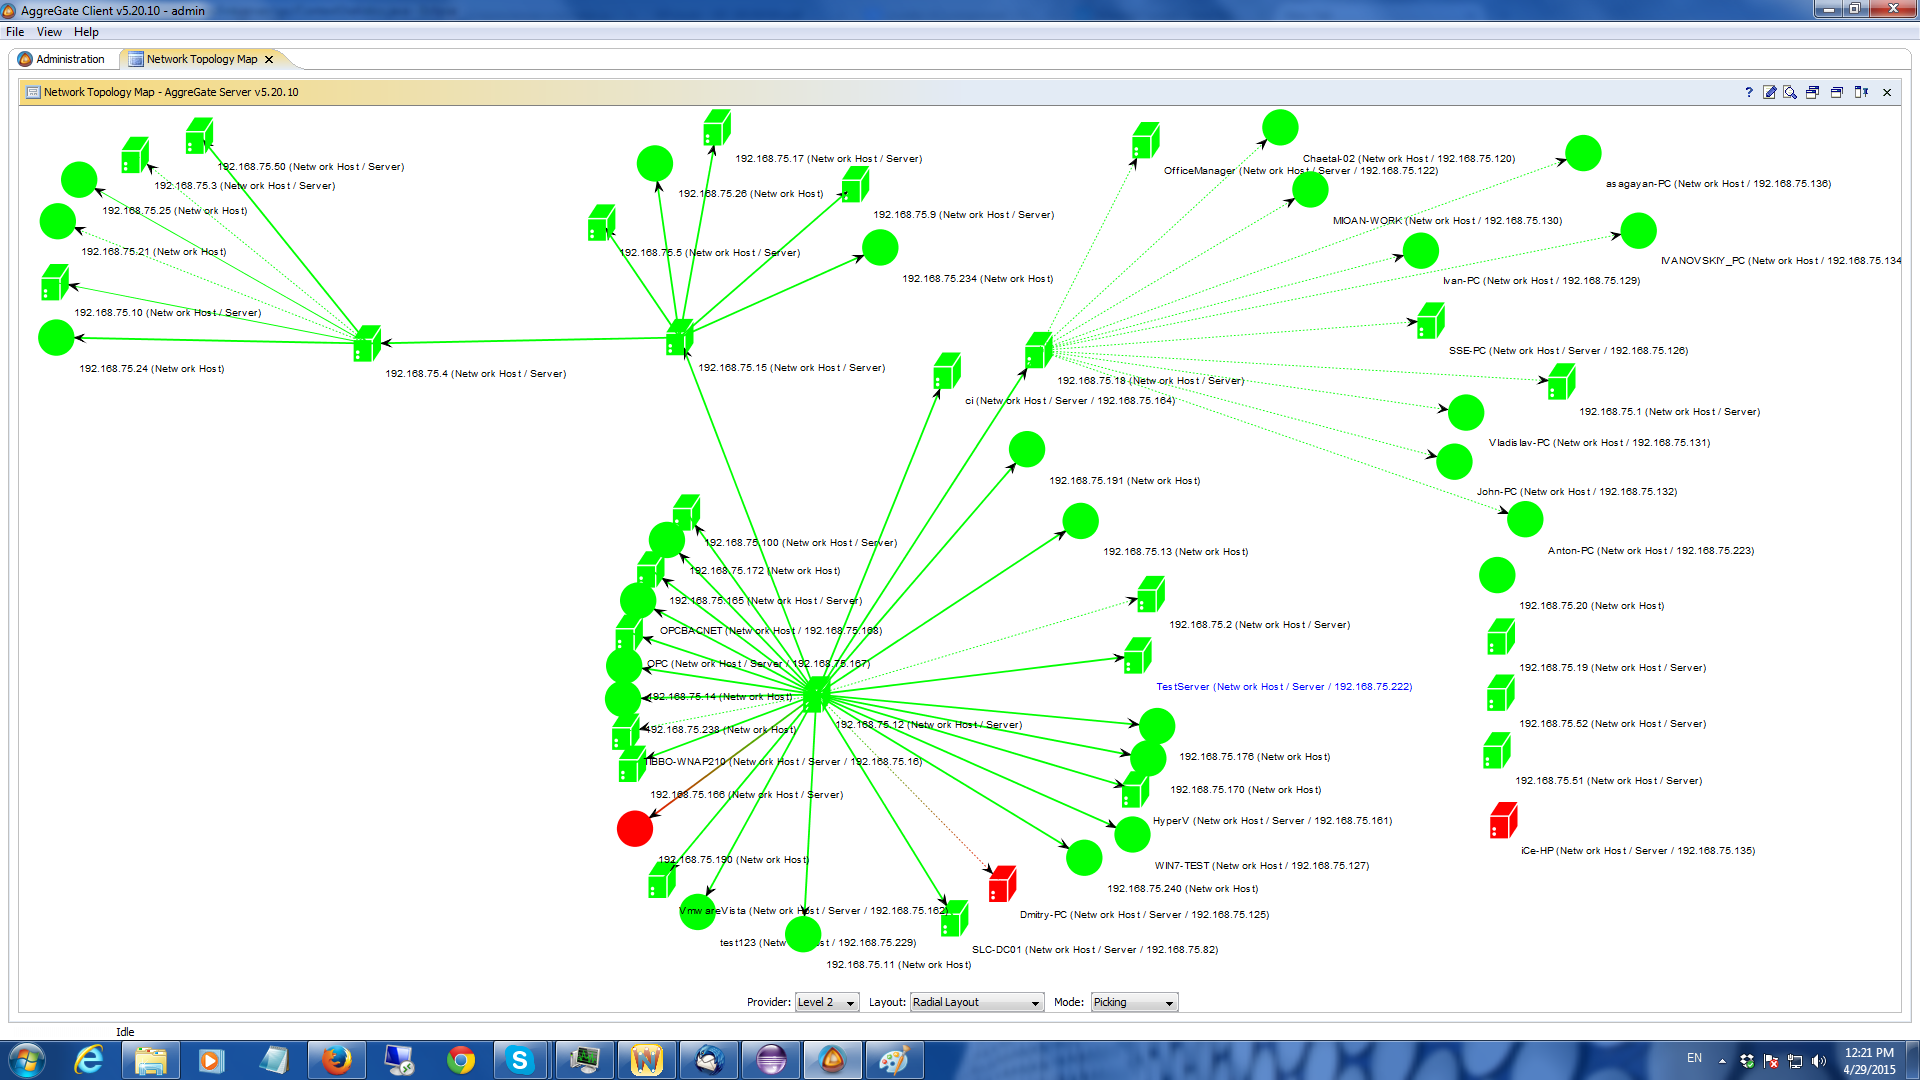
Many partners and customer will appreciate the long-awaited transparent graph layout saving feature.
A Graph UI component is enhanced to automatically save its current visual layout. A user can manually edit node positions by drag-and-drop and layout info will get persistently stored on the server. When a widget with a graph component is opened next time, graph layout is restored to the last saved state. You're welcome to create your own customized network topology maps!
You can get more information about AggreGate Network Manager capabilities here.
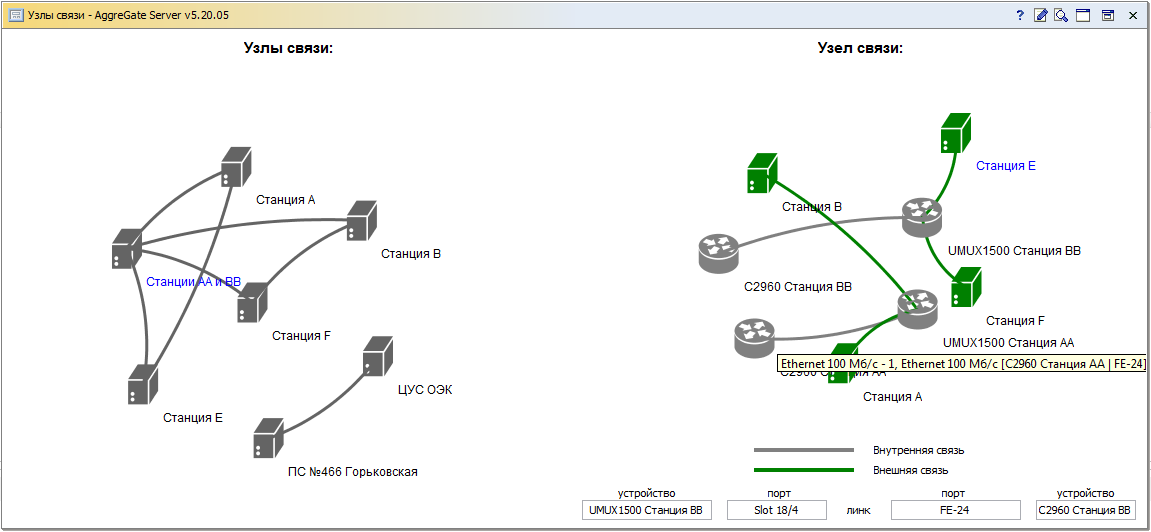
Tibbo team has successfully designed and deployed the system for a multi-service SDH/PDH network monitoring for United Energy Company. Being one of the largest electric grid companies in Moscow, UEC JSC provides electricity transmission and distribution, technological connection and new networks building.
United Energy Company Management chose Tibbo AggreGate Platform for building reliable communication channel supervision system. Once the project was finished, United Energy Company has got a unique SDH/PDH networks monitoring tool that improved quality and stability of network services. Communication channels and equipment troubleshooting time has been dramatically reduced. Timely information sharing on hardware status, power supply specifications, cooling system state has cut down incident count. The system has been justly appreciated and accepted into service.
For details on the project implementation, as well as on deployed hardware and software view the Case Study.
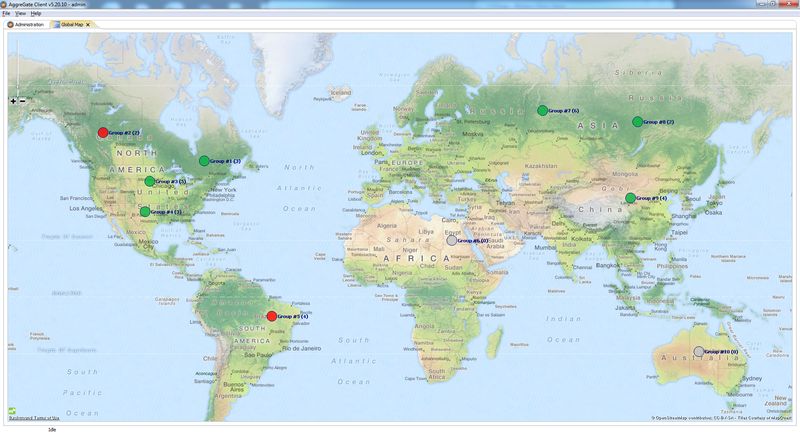
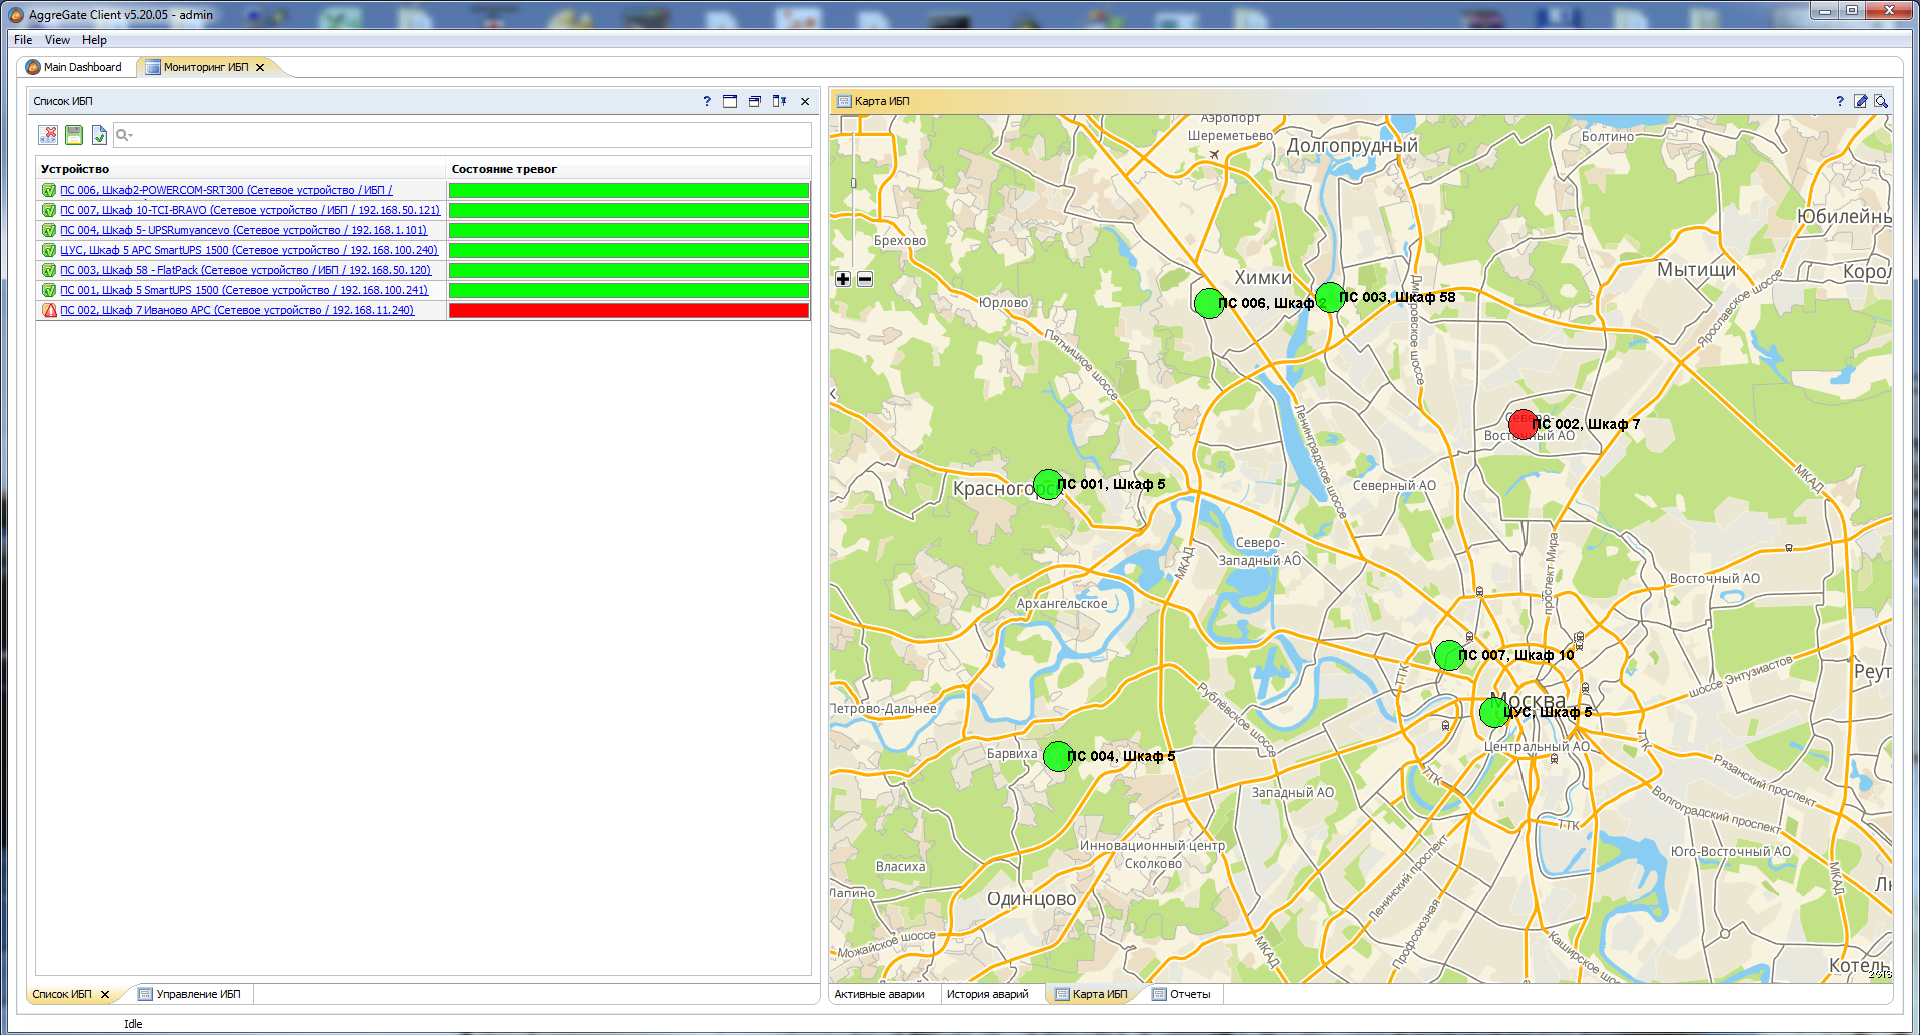
We’ve recently added support for displaying device groups on geographical and topological maps. Devices can be combined into groups and each group is associated with specific geographic coordinates and links to other groups or individual devices.
This new feature allows to design multi-level maps with drill-down capabilities. Imagine a company that provides technical services for Base Telecom Stations in a certain geographical region. Each BTS is a group of devices that includes power management units, security devices, telecom equipment, environment sensors and controllers, etc. Base stations are connected to each other by communication channels, and station-to-station links can be configured through a Topology section of a device group matching each BTS.
Operators get a map that displays stations and their communication channels, as well as overall status of all equipment in each BTS. They can navigate from the map to BTS overview screens and then down to individual device dashboards.
You can get more information about AggreGate Network Manager capabilities here.
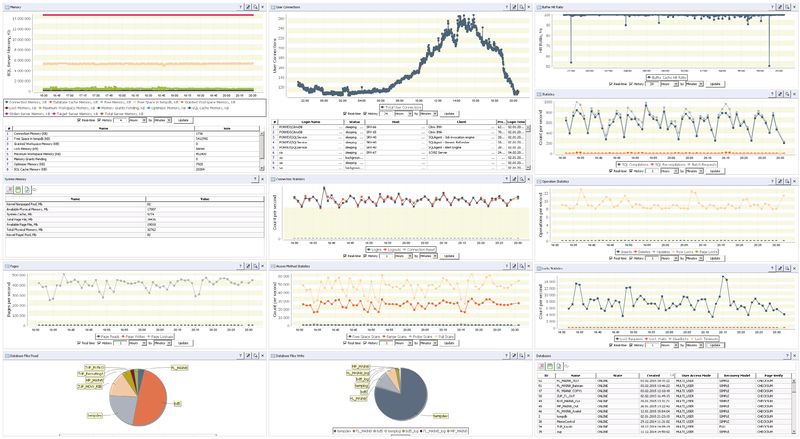
Pony Express was seeking for a solution to monitor state and performance of more than 70 business-critical Windows-based and FreeBSD-based servers acting as VPN, mail, database, web, DNS, collaboration and proxy servers. It was also crucial to track mission-critical enterprise applications and their database performance. Among other essential tasks was network equipment state and performance monitoring, including traffic control and tracking the bandwidth usage threshold crossing. It was also important to see the network traffic structure, i.e. applications and services occupying most network resources.
For meeting the project requirements, Pony Express IT management selected AggreGate Network Manager which, unlike its competitors, possessed all necessary tools for the existing IT infrastructure monitoring out-of-the-box.
The Network Manager tracks key performance metrics of servers, as well as core switches and routers by Hewlett Packard, 3COM and Cisco Systems. Application monitoring is enabled for Microsoft Exchange Server 2010 and Microsoft SharePoint Server 2010. One of the project objectives was applying standard profiles to monitor more than 10 Microsoft SQL Server 2000/2008 databases, including databases in a failover cluster mode used by lots of enterprise applications. Network traffic structure is easily discovered by collecting NetFlow v9 data and visualized by Network Manager.
AggreGate Network Manager made it possible to monitor the whole IT infrastructure from a single point. It helped to discover inefficiently used resources and bottlenecks reacting to potentially dangerous incidents before they appear. This prevented service downtime and minimized ticket count from the company staff. Ultimately, a synergistic effect was achieved – staff idle hours decreased while labor efficiency increased and the overall benefit from IT infrastructure utilization went up. View Case Study
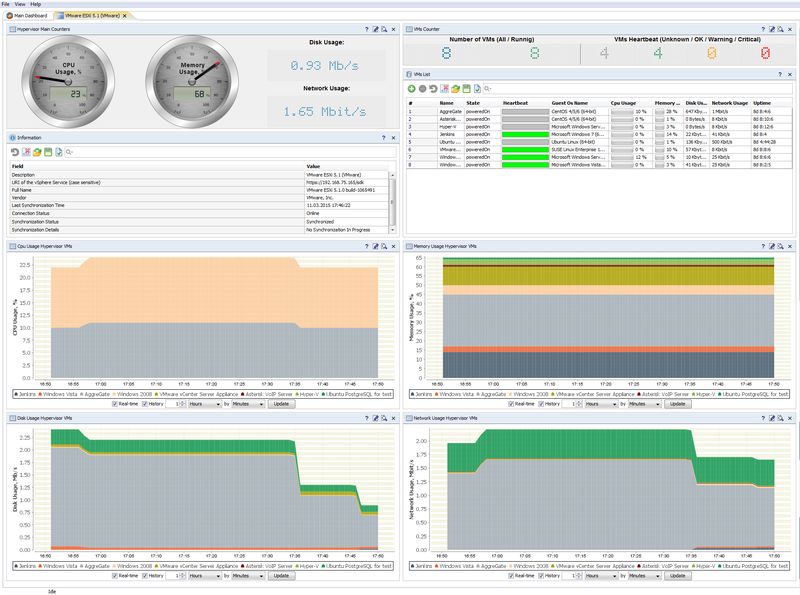
AggreGate Network Manager enables out-of-the-box monitoring for your virtual infrastructure.
It can monitor health, status and performance metrics of VMware vSphere/ESX/ESXi and Microsoft Hyper-V, as well as individual guest VMs.
Network Manager license for 10 devices is free. It means that you can monitor up to ten hypervisors simultaneously, but number of virtual machines monitored through them is unlimited.
To activate a free license download AggreGate Network Manager and select Free license type during the installation.
Let us know how it works for you! We will post interesting scenarios in our blog.
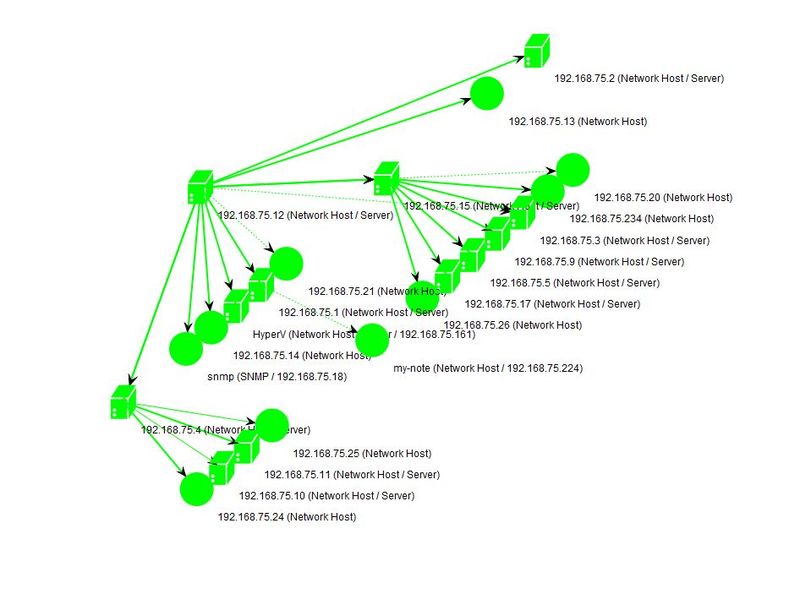
New release of AggreGate Network Manager features improved L2 network discovery algorithm that relies on Link Layer Discovery Protocol (LLDP) and Cisco Discovery Protocol (CDP). Those protocols enable accurate detection of switch-to-switch and switch-to-router connections, as well as connections between switches and other network devices.
Topology visualization module has been also extended to support new tree and balloon layouts:
Try new Early Access Program release of Network Manager 5.2 by downloading a trial.
Tibbo engineers jointly with Unitel CJSC have given an AggreGate Platform presentation for MOESK JSC. Being one of the largest electric grid operators in Russia, MOESK specializes in rendering electric power transmission service and connecting consumers to the Moscow region grid.
AggreGate Network Manager was selected as a potentially suitable monitoring tool for communication equipment and its power supply systems at MOESK JSC electric substations. Wide AggreGate Platform capabilities allow achieving the main project objective by increasing the communication system reliability through efficient power options control and minimizing troubleshooting and accident management time.
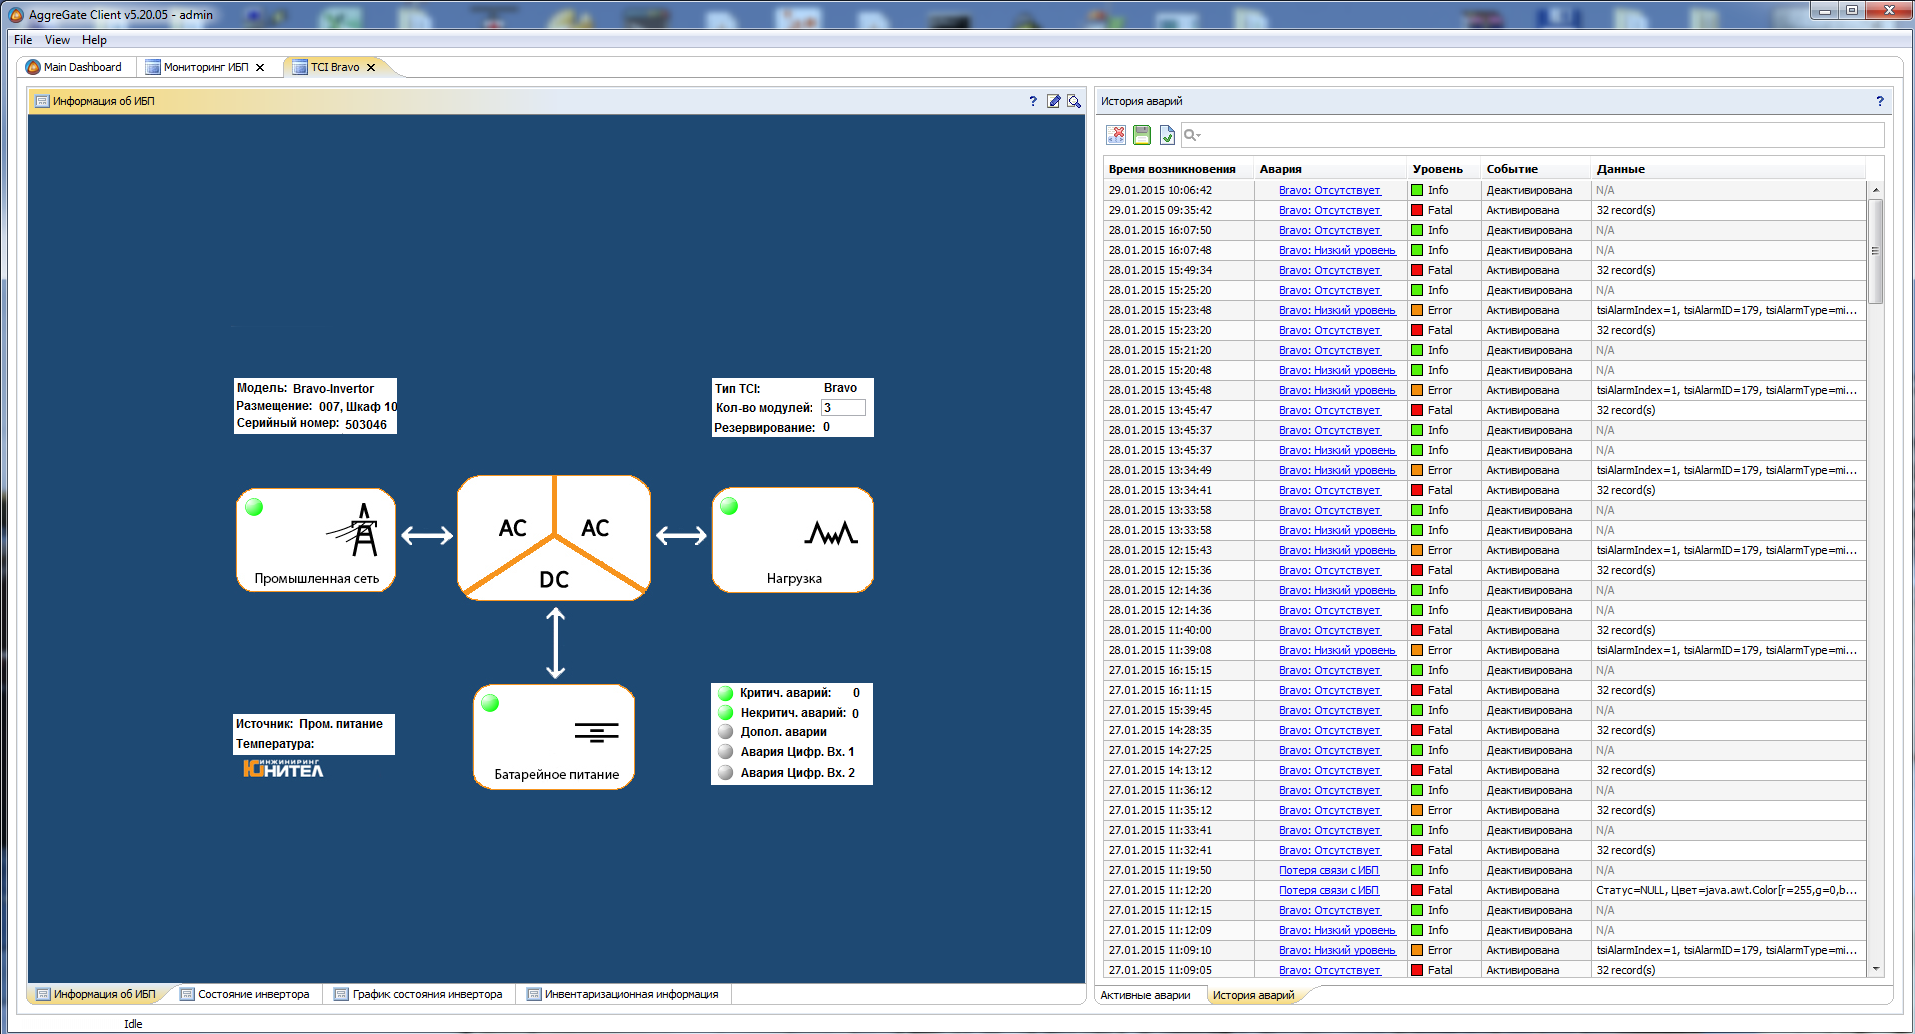
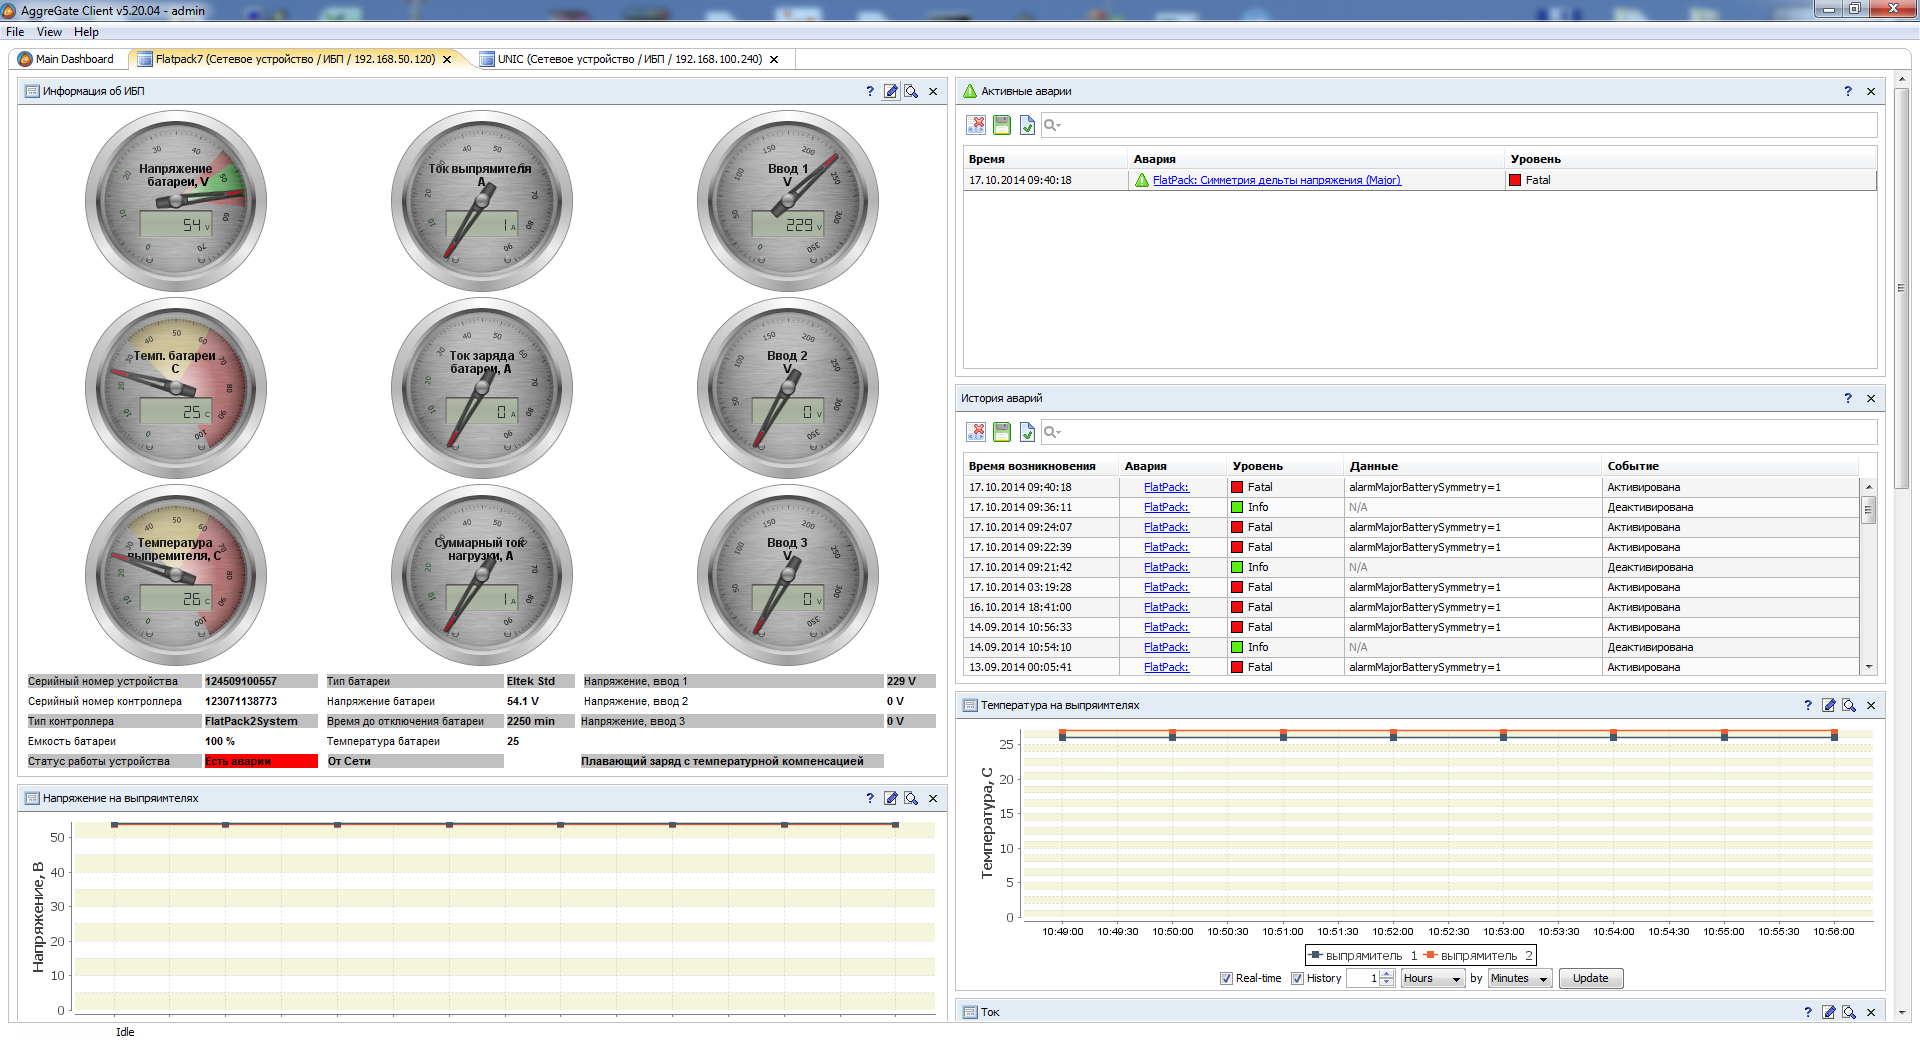
Tibbo engineers have successfully designed and implemented a comprehensive monitoring system for enterprise communication equipment of United Energy Company JSC. Being one of the largest electric grid operators of Moscow, United Energy specializes in development, operation and reconstruction of the city’s power networks.
The main objective of the project was improving the maintenance service efficiency and communication engineers work as well as increasing the communications system reliability.
Therefore, the following subtasks were set: design of a control system for uninterruptible power systems, supervision over UPS parameters at remote sites, decrease of power supply system incident response time, reduction of disaster recovery time etc.
To achieve the objectives, Tibbo AggreGate Network Manager was selected. It allows staff to track the general state of the power system and per-unit real-time details. In addition to UPS monitoring, the system tracks the monitoring server itself as well as network equipment.
New power setting control tools based on Tibbo AggreGate intelligent platform make it possible to monitor and resolve problems at communication sites. In many cases they also help to solve a problem before it arises. View case study
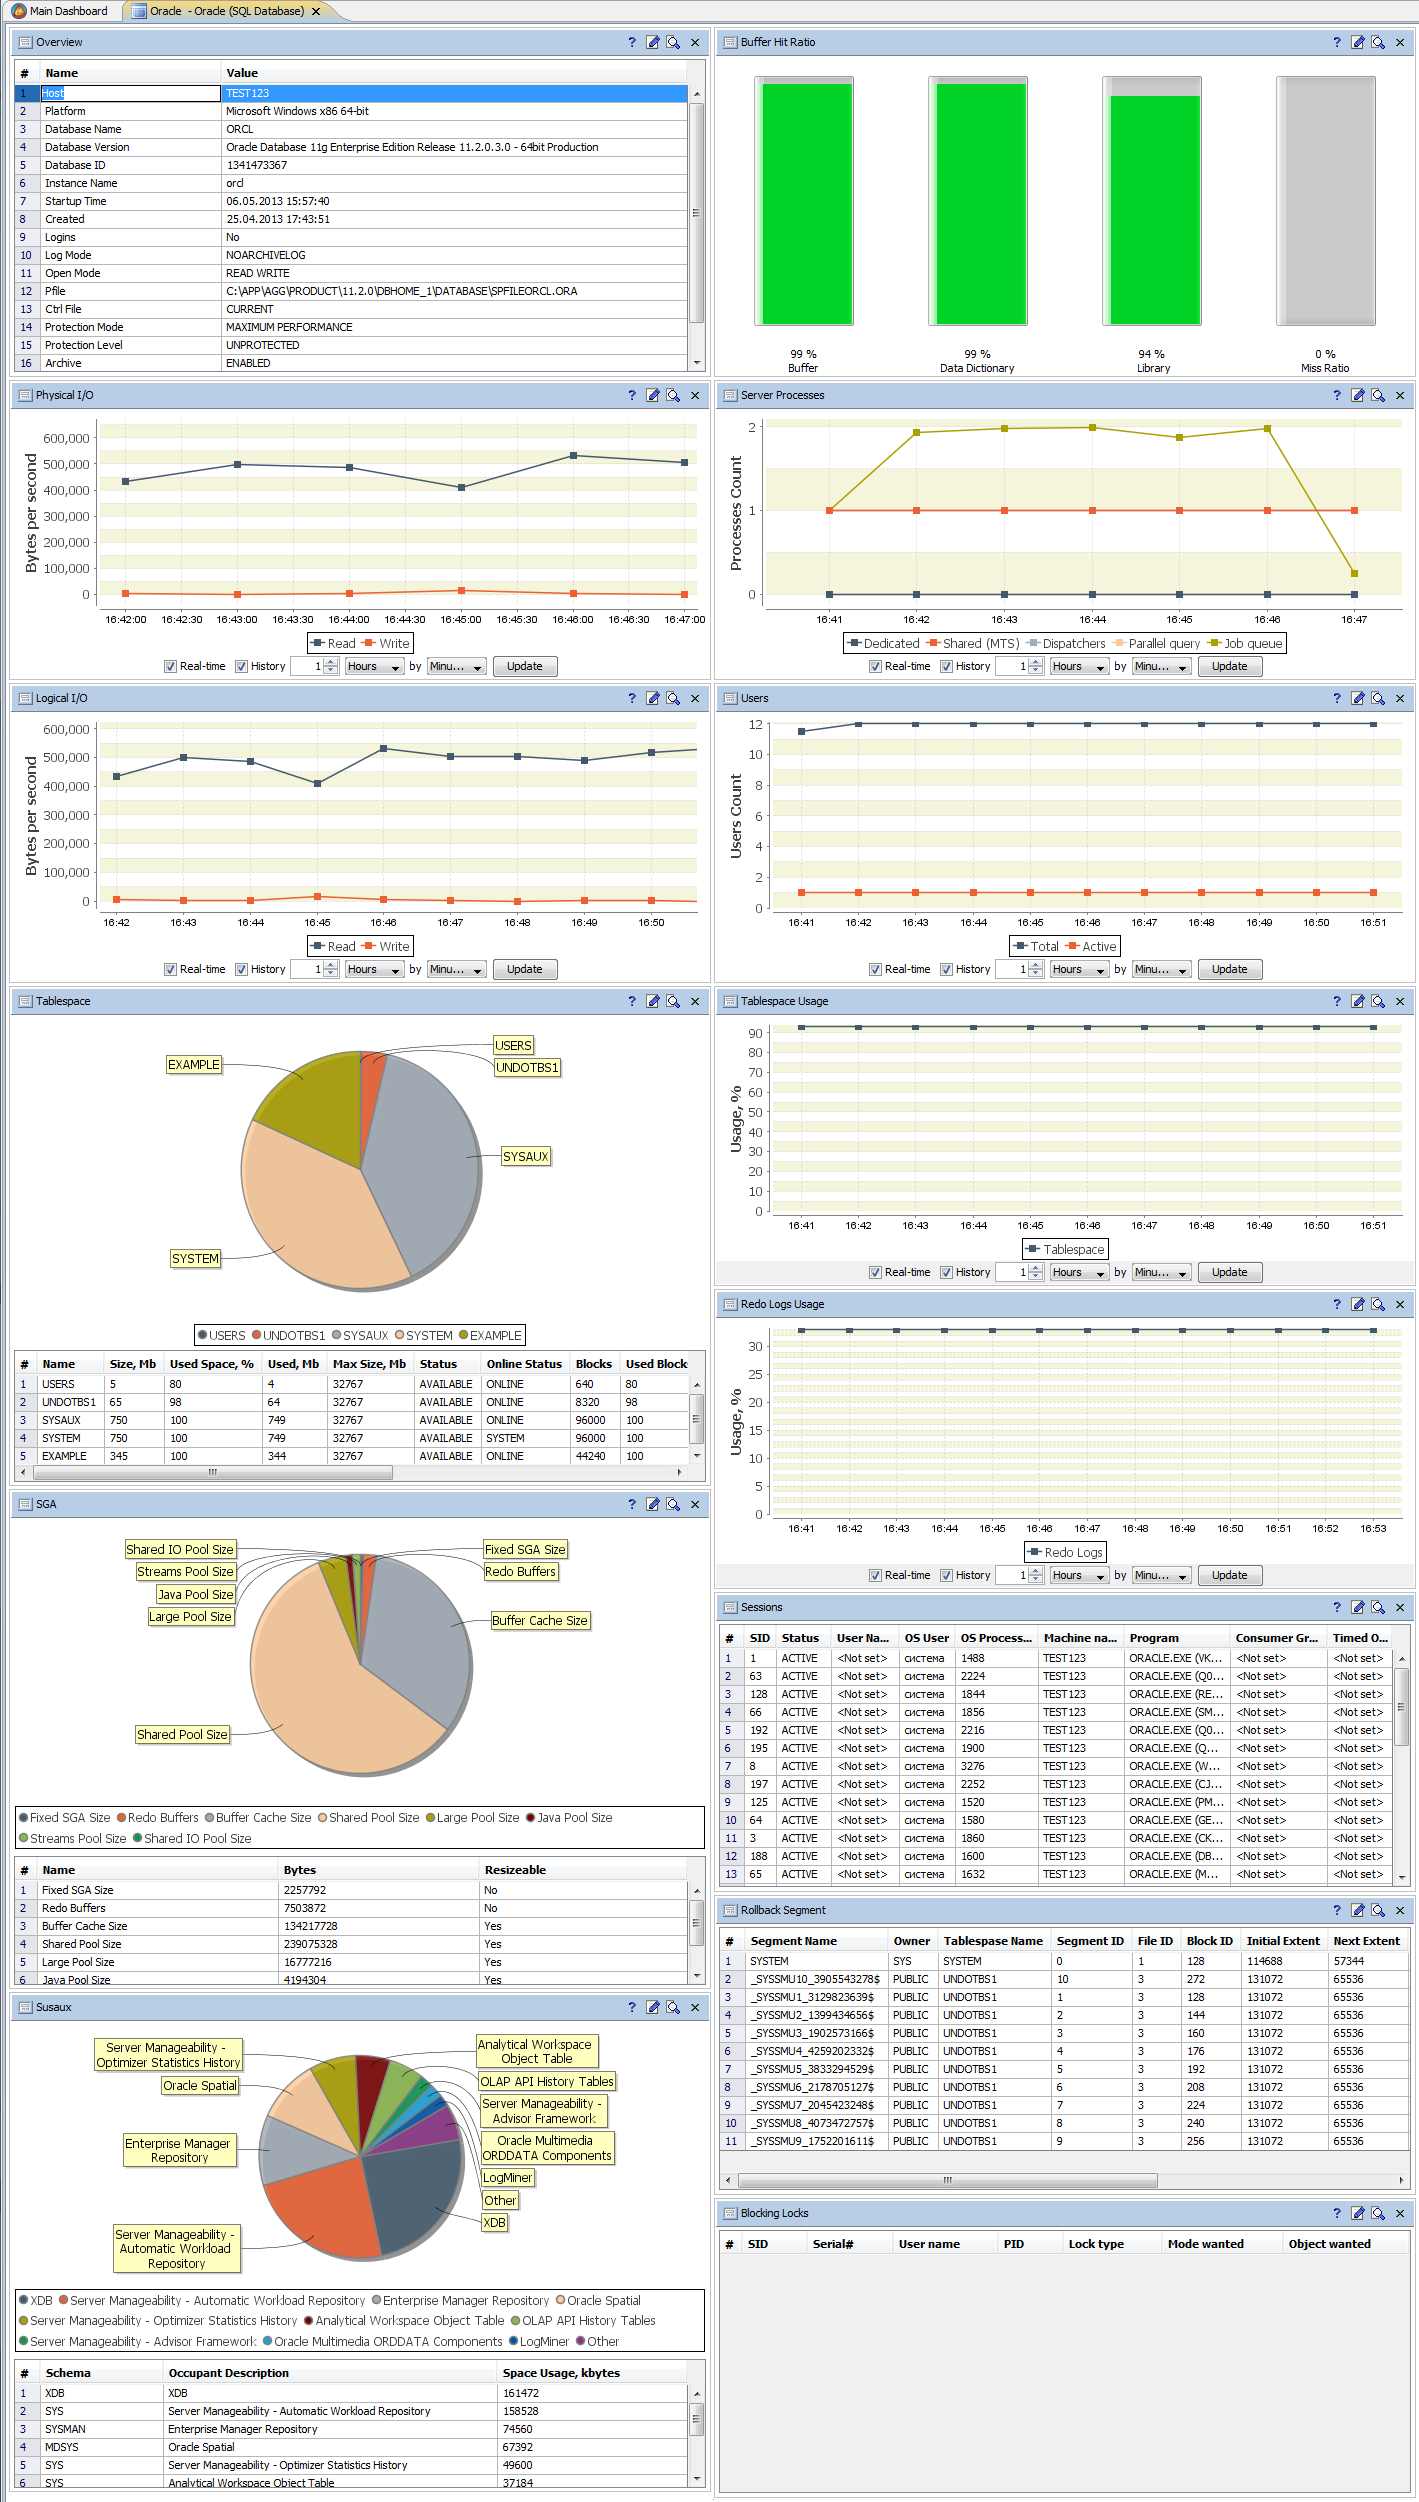
AggreGate Network Manager offers advanced database performance monitoring capabilities. It can monitor health, status and performance metrics of Microsoft SQL Server, Oracle, MySQL, PostgreSQL and any other DBMS.
Network Manager license for 10 devices is free. This doesn’t mean so much if we’re talking about “classic” network monitoring. However, monitoring ten database servers can mean being able to build company-wide database monitoring project for an SMB!
To activate a free license download AggreGate Network Manager and select Free license type during the installation process.
Will also work for SNMP- and WMI-based metric collection!