We've published localized Chinese versions of AggreGate Platform and all derived solutions! You can download the Platform from Downloads - just choose Chinese during installation to test it out.
Category: Company News
Introducing C/C++ SDK for Low-cost Device Interface
Despite AggreGate Agent and even full-blown AggreGate Server can run on single-board PCs like Raspberry Pi and BeagleBone Black, up to now that wasn't possible to launch Agent in low-cost devices like Arduino.
This has changed with the publication of open-source AggreGate C/C++ SDK. The SDK helps to build Agent library into the C/C++ code of main device application to make it natively compatible with AggreGate. It also includes API for interfacing the server in a "client mode", allowing full server control from within any C/C++ application.
You can download AggreGate C/C++ SDK from https://aggregate.digital/downloads.html.
Any feedback is highly appreciated!
AggreGate Data Storage Options
AggreGate Server stores enormous amount of data collected from a device network and generated internally:
- Definitions and configuration of server modules and system resources
- Audit trail of all system operations and events
- Historical values of device metrics
- Persistent events received from the network
- History of synthetic internal metrics and events
All data items stored by the server are divided in two major groups: configuration and events.
We’ve Started a Youtube Channel!
Meet our first video 🙂
AggreGate SCADA Monitors Roadheading Equipment of a Mining Company
Tibbo engineers have deployed a roadheading equipment monitoring system for Ilma machine-building company. Being the well-known mining company among professionals in Russia, Ukraine, Kazakhstan, Belarus, Germany, Poland and China, Ilma specializes in design, manufacturing and maintenance of mining equipment control systems.
The key Ilma project task involved real-time monitoring of roadheading telemetry data. Therefore, a set of reliable and user-friendly tools for collecting, storing, processing as well as visualizing statistical and historical values were strongly needed. For solving this task, Ilma has chosen AggreGate SCADA/HMI.
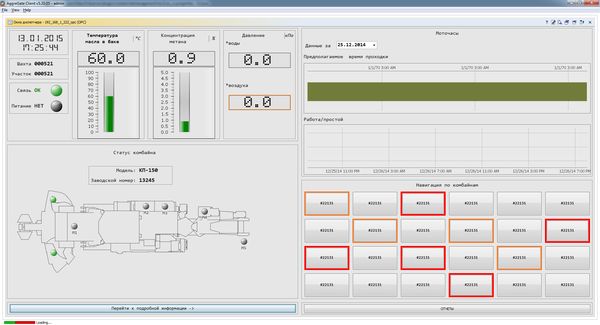 | 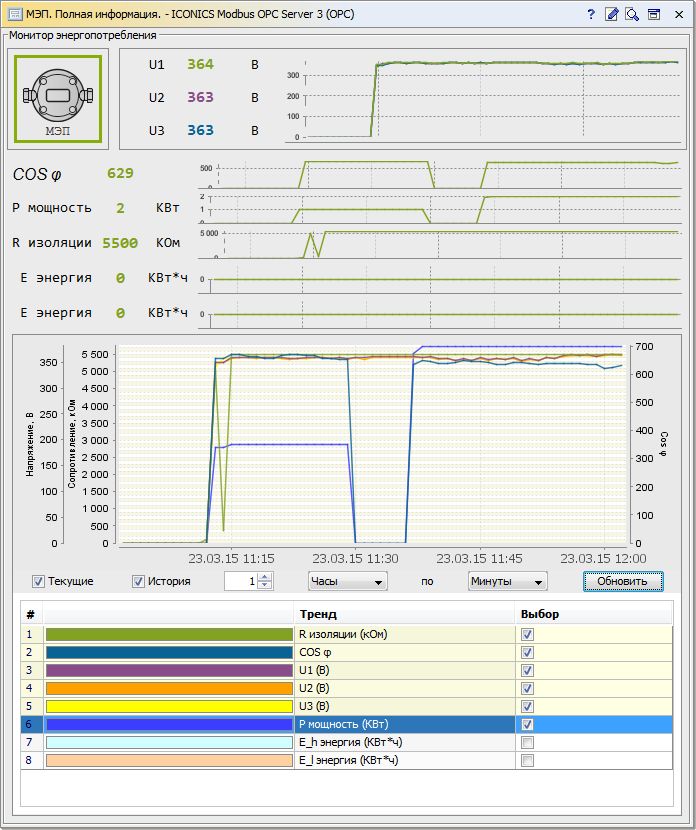 |
Thanks to advanced AggreGate SCADA/HMI tools, the centralized monitoring and data acquisition system is used for process monitoring by control room operators. Technicians use it to analyze machine state while financial officers and managers benefit from business process and personnel performance analysis.
View a Case Study and contact us for any details.
How are Industries Adopting IoT?
Check our partner's article about IoT features on LinkedIn.
AggreGate Network Manager Monitors Multi-branch IT Infrastructure of Russia’s Largest Express Delivery Operator Pony Express
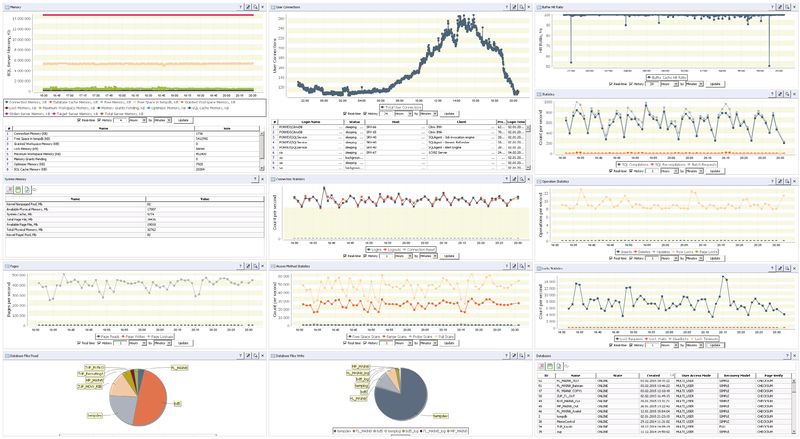 Pony Express was seeking for a solution to monitor state and performance of more than 70 business-critical Windows-based and FreeBSD-based servers acting as VPN, mail, database, web, DNS, collaboration and proxy servers. It was also crucial to track mission-critical enterprise applications and their database performance. Among other essential tasks was network equipment state and performance monitoring, including traffic control and tracking the bandwidth usage threshold crossing. It was also important to see the network traffic structure, i.e. applications and services occupying most network resources.
For meeting the project requirements, Pony Express IT management selected AggreGate Network Manager which, unlike its competitors, possessed all necessary tools for the existing IT infrastructure monitoring out-of-the-box.
The Network Manager tracks key performance metrics of servers, as well as core switches and routers by Hewlett Packard, 3COM and Cisco Systems. Application monitoring is enabled for Microsoft Exchange Server 2010 and Microsoft SharePoint Server 2010. One of the project objectives was applying standard profiles to monitor more than 10 Microsoft SQL Server 2000/2008 databases, including databases in a failover cluster mode used by lots of enterprise applications. Network traffic structure is easily discovered by collecting NetFlow v9 data and visualized by Network Manager.
AggreGate Network Manager made it possible to monitor the whole IT infrastructure from a single point. It helped to discover inefficiently used resources and bottlenecks reacting to potentially dangerous incidents before they appear. This prevented service downtime and minimized ticket count from the company staff. Ultimately, a synergistic effect was achieved – staff idle hours decreased while labor efficiency increased and the overall benefit from IT infrastructure utilization went up. View Case Study
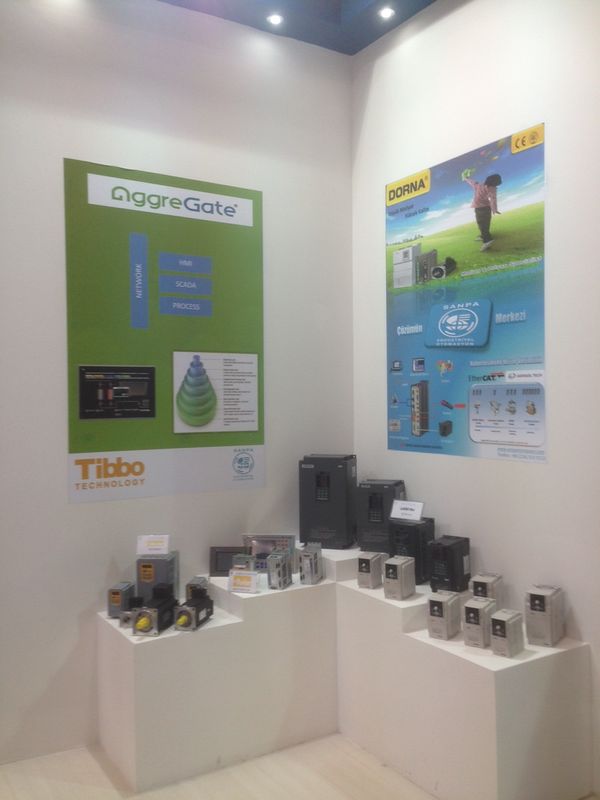
AggreGate Presented @ WIN Fair Istanbul
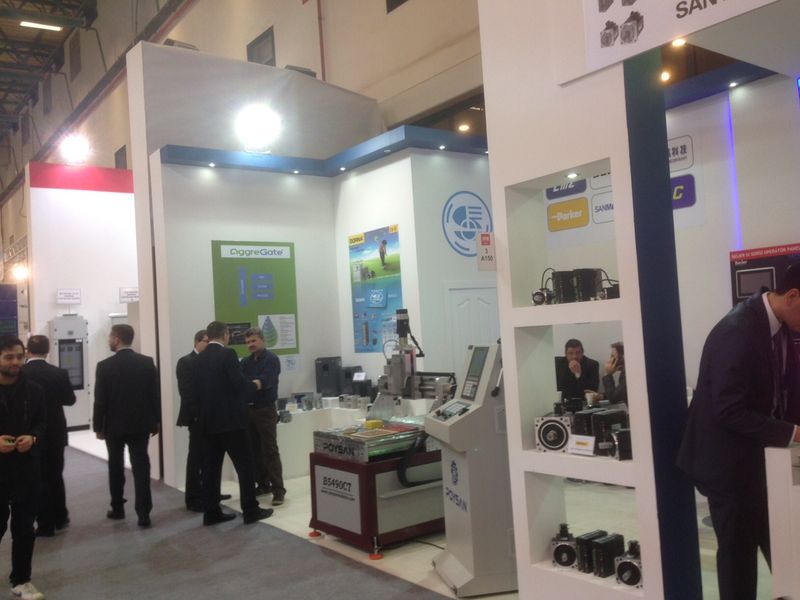
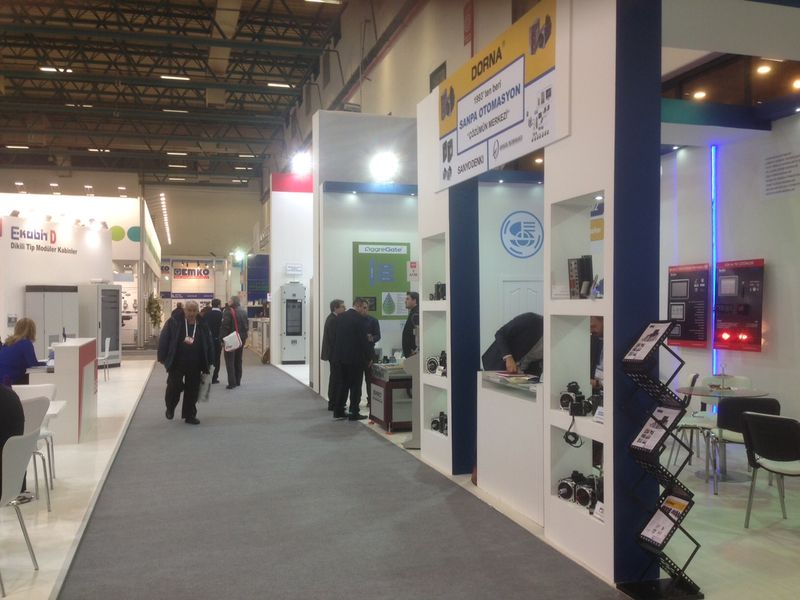
Our new Turkish partner, Entek Elektronik, took part in a big automation fair in Istanbul together with their SANPA partner. Their mission in this fair was to present and explain AggreGate to visitors. It was a successful start.
 |
|

|
|

|
Check a New Article About AggreGate Performance and Scalability
AggreGate Platform was designed with unlimited scalability in mind. While communication with a million devices definitely requires multiple servers to get joined into a distributed installation, but even a single AggreGate Server can demonstrate impressive performance figures. Read the full article here.
Monitor Your Virtual Infrastructure for Free!
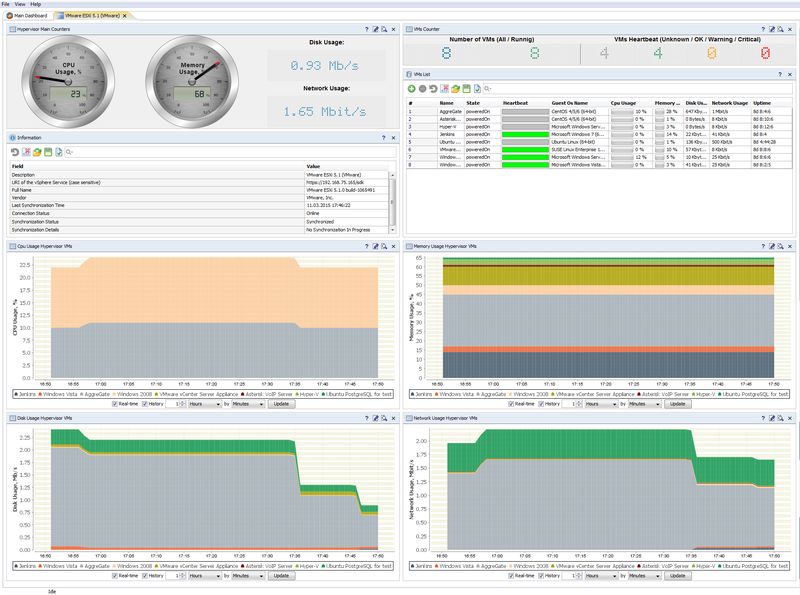
AggreGate Network Manager enables out-of-the-box monitoring for your virtual infrastructure. It can monitor health, status and performance metrics of VMware vSphere/ESX/ESXi and Microsoft Hyper-V, as well as individual guest VMs.
 | 
|
Network Manager license for 10 devices is free. It means that you can monitor up to ten hypervisors simultaneously, but number of virtual machines monitored through them is unlimited. To activate a free license download AggreGate Network Manager and select Free license type during the installation. Let us know how it works for you! We will post interesting scenarios in our blog.